
Claude Token Meter
A macOS menu bar app that tracks Claude session usage in real time


Context
I kept getting blindsided by my own AI token usage
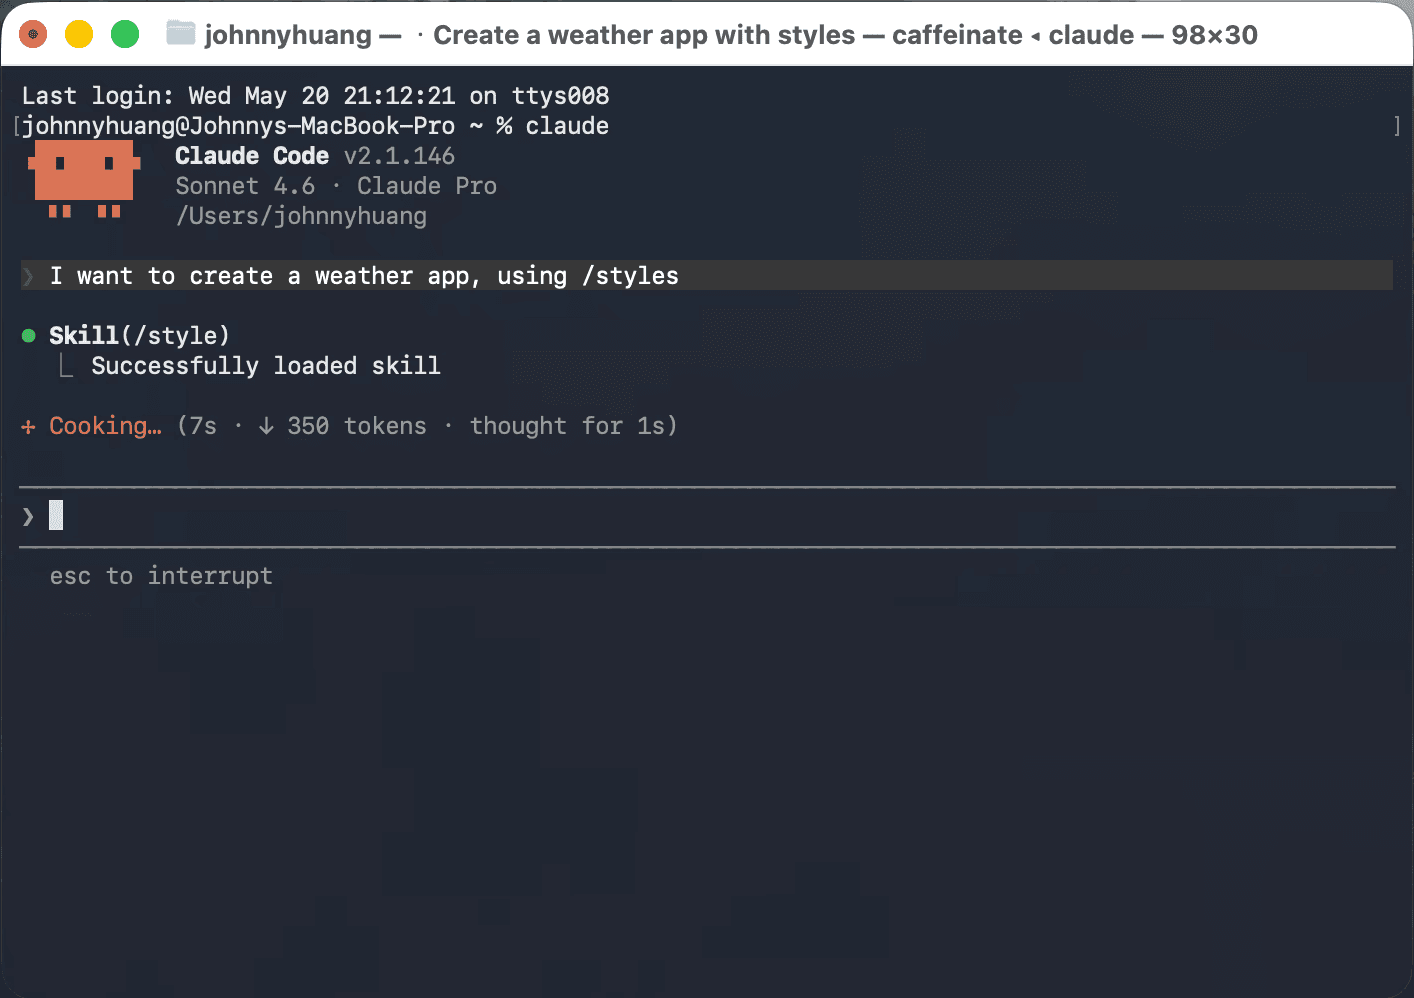
This project started as a personal need. I use Claude Code heavily for personal work, and the 5-hour session limit often resets in the middle of my workflow.
The problem was I never knew where I stood until the session was already gone. Claude doesn't surface usage anywhere visible or easily accessible, often suddenly cut off mid-conversation because I unexpectedly hit the usage limit.
So I built a menu bar app to fix that.
Claude Code
Python (PyObjC)
WKWebView, HTML/CSS/JS, anime.js
The problem
Claude provides no ambient awareness of usage. I identified two problems:
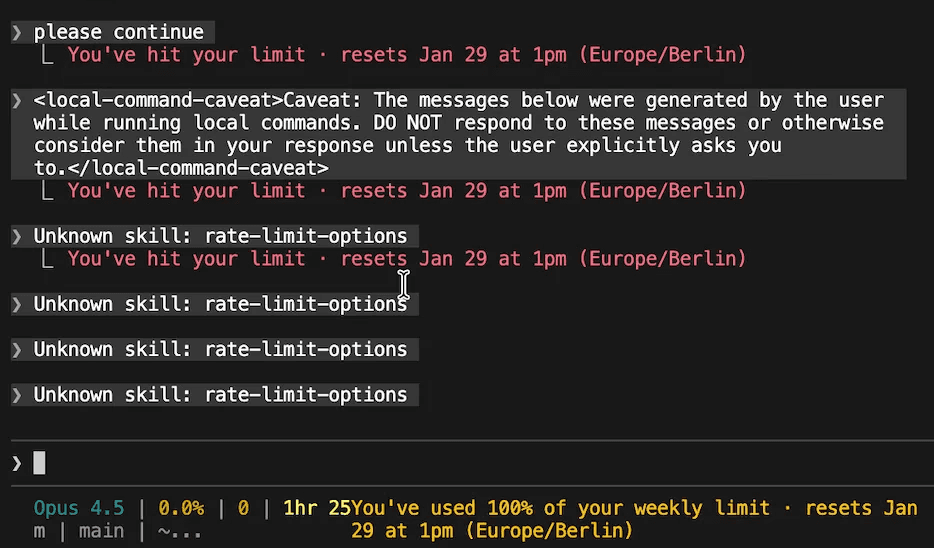
I dont know my token usage until I hit the limit
The terminal shows a hard cutoff with no warning. By the time you see "You've hit your limit," the session is already gone.
Taking users out of context
The only built-in option is typing /status or /usage in Claude Code. It takes over your terminal, takes you out of context and breaks your train of thought.
Solution
A macOS menu bar app built around three ideas:
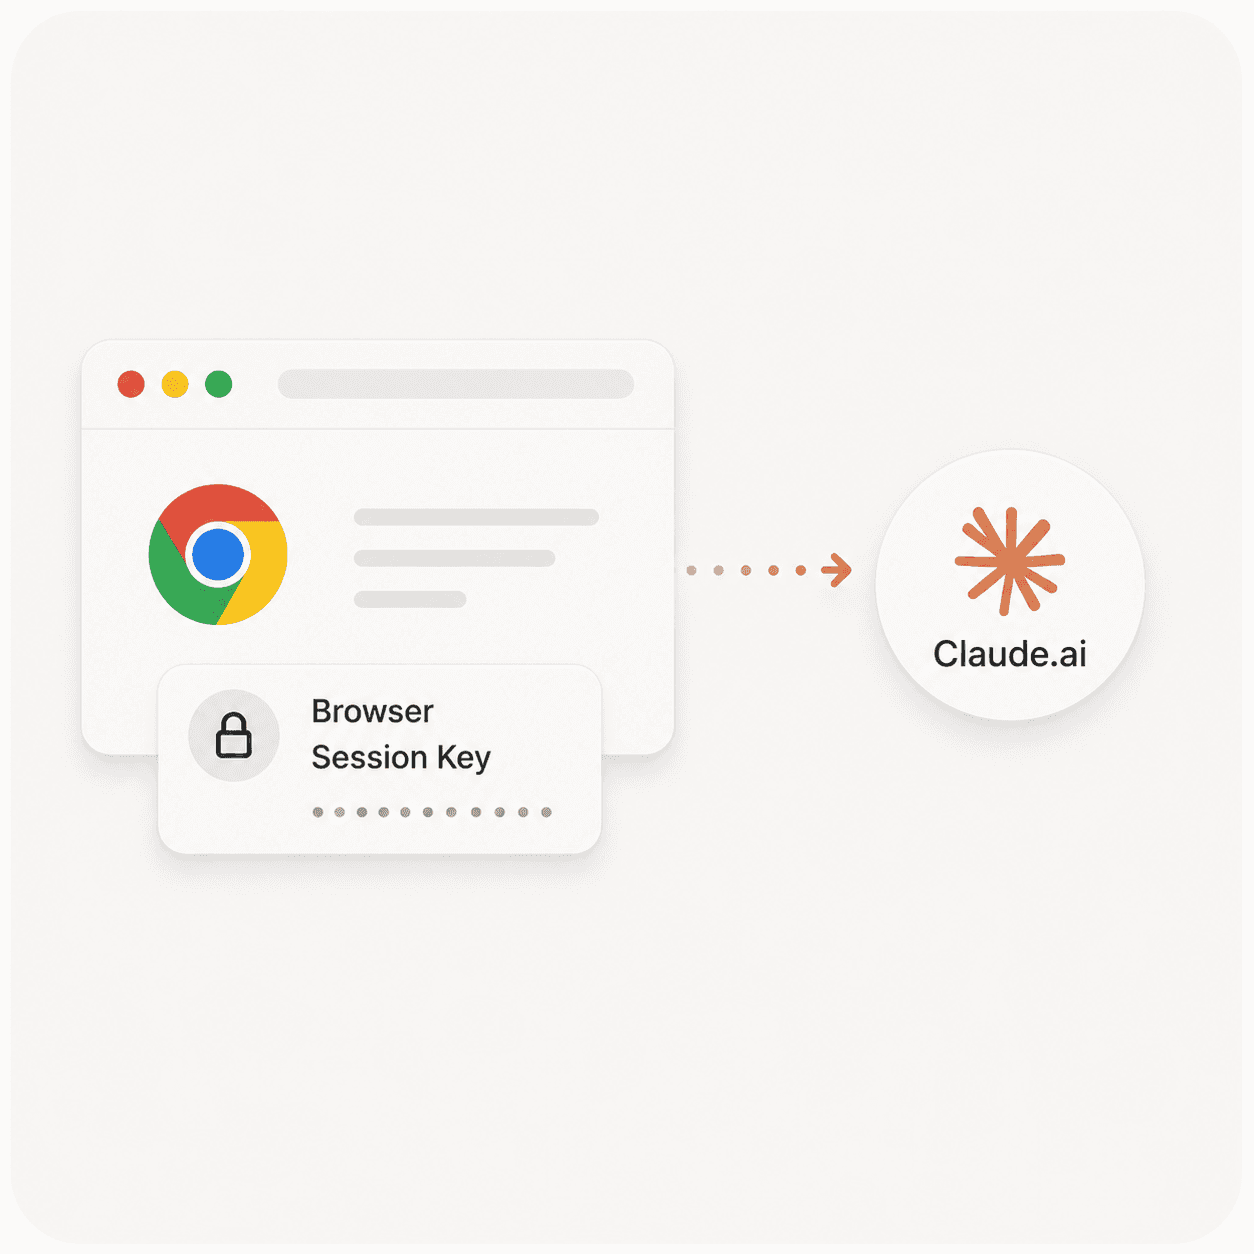
Leverage Chrome Cookie Key to fetch usage data
Claude doesn't expose usage data via API. By pasting your browser session key once, the app pulls live data directly from Claude.ai.
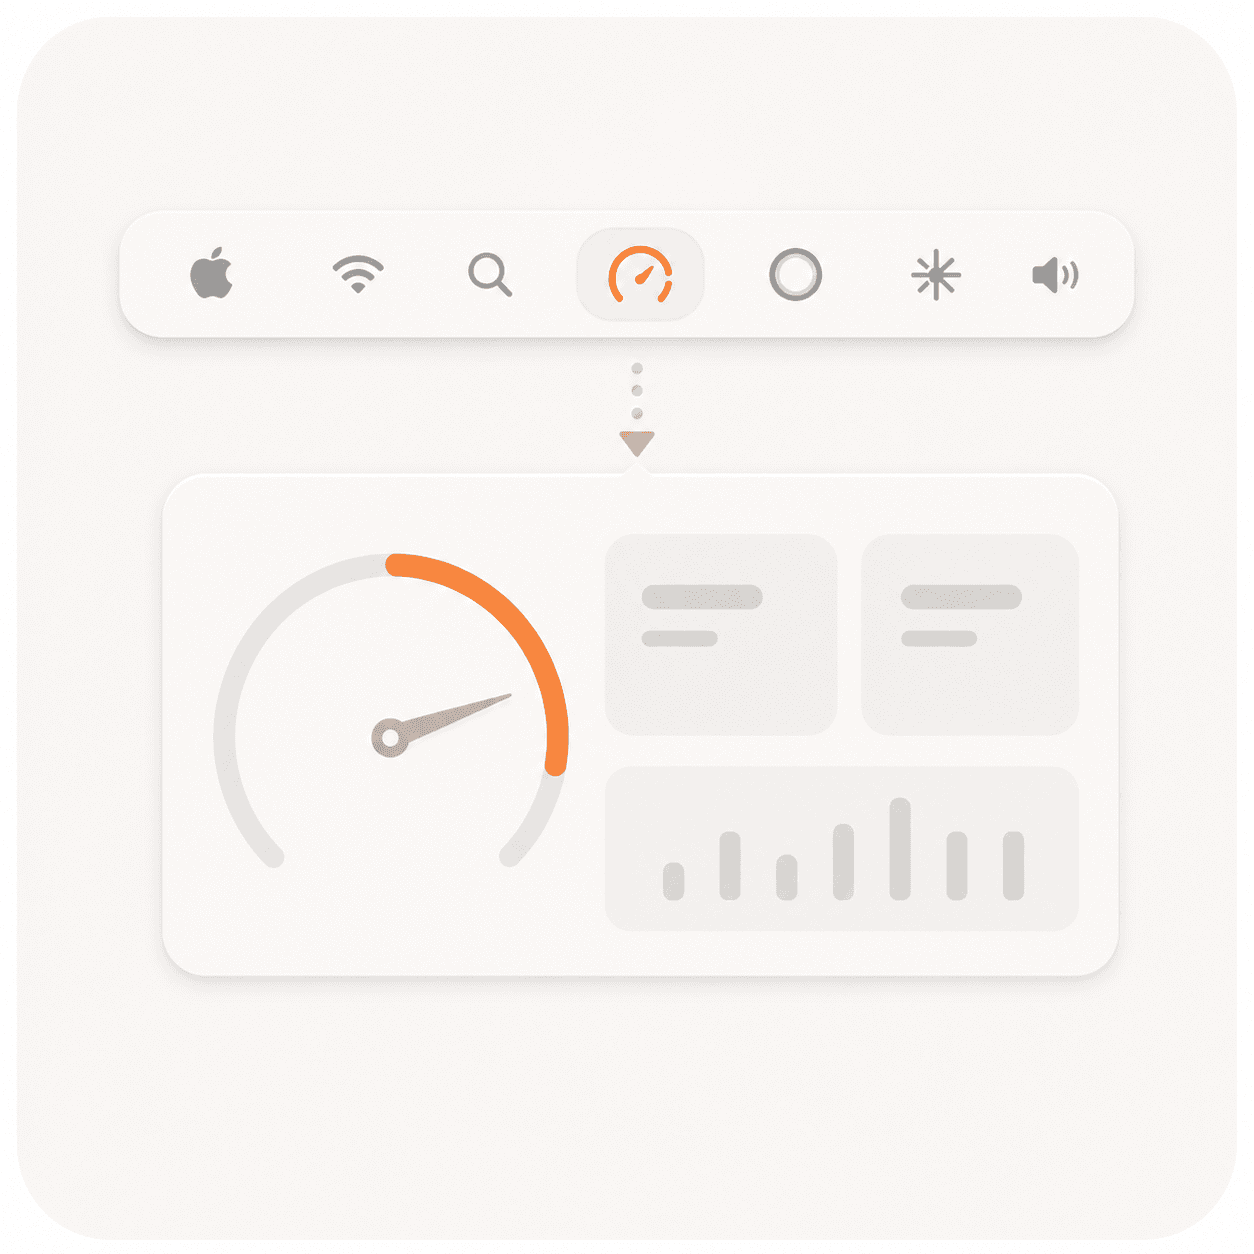
Mac Systems Menu bar visualisation
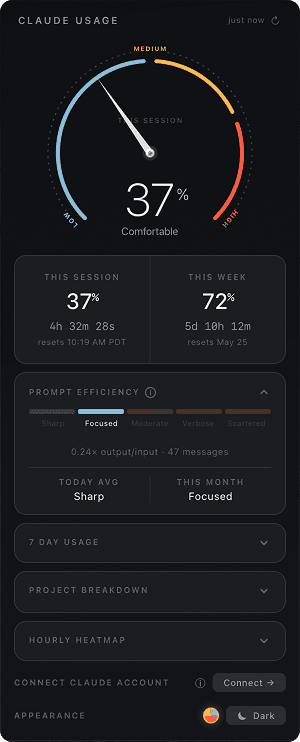
The meter lives in your menu bar as a live percentage. It starts as just a minimal number, click and the full breakdown expands whenever you need it.
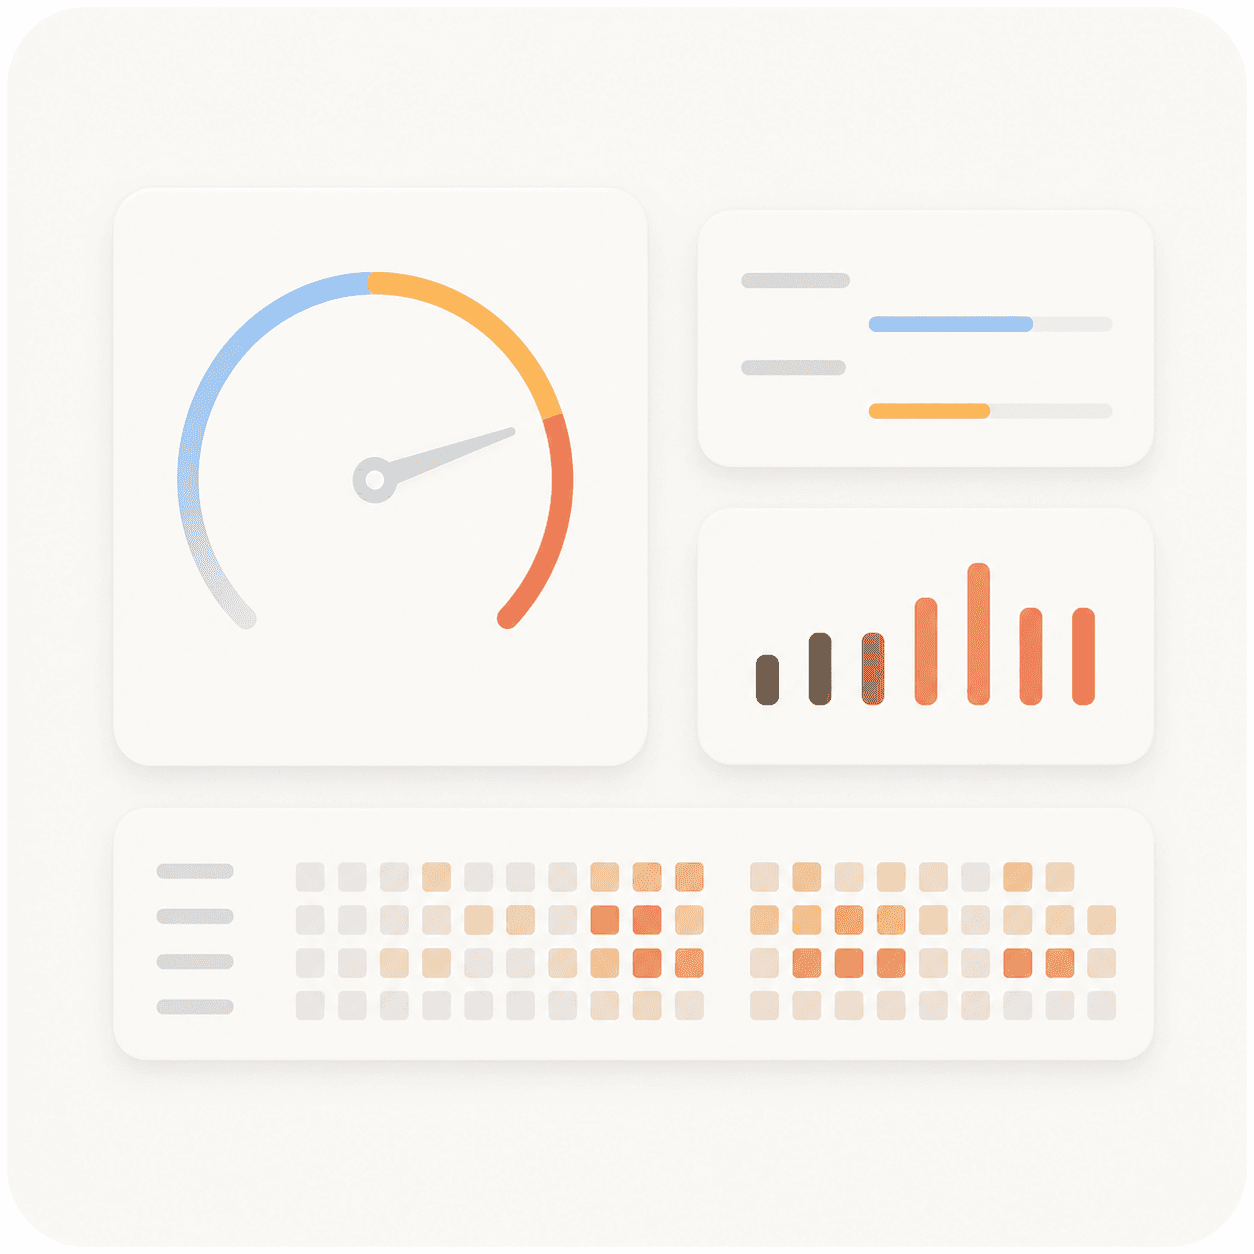
Expanded popup for additional details:
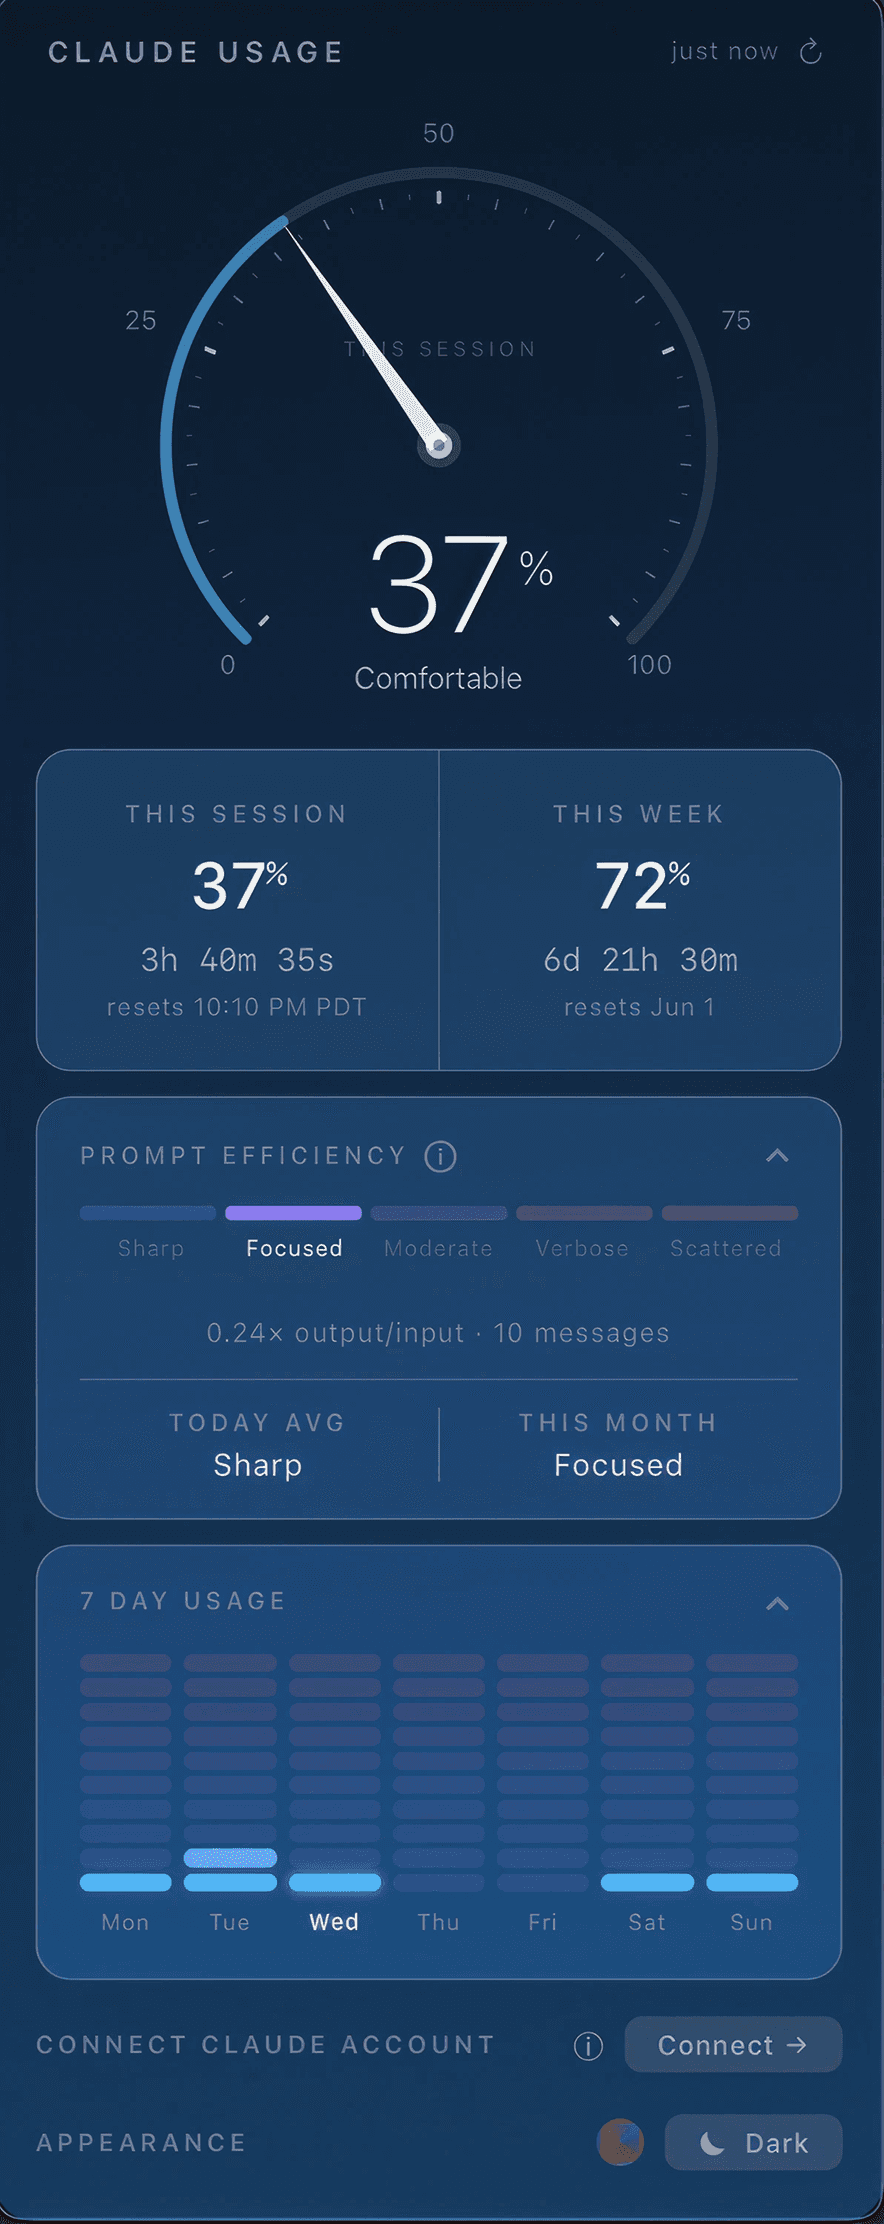
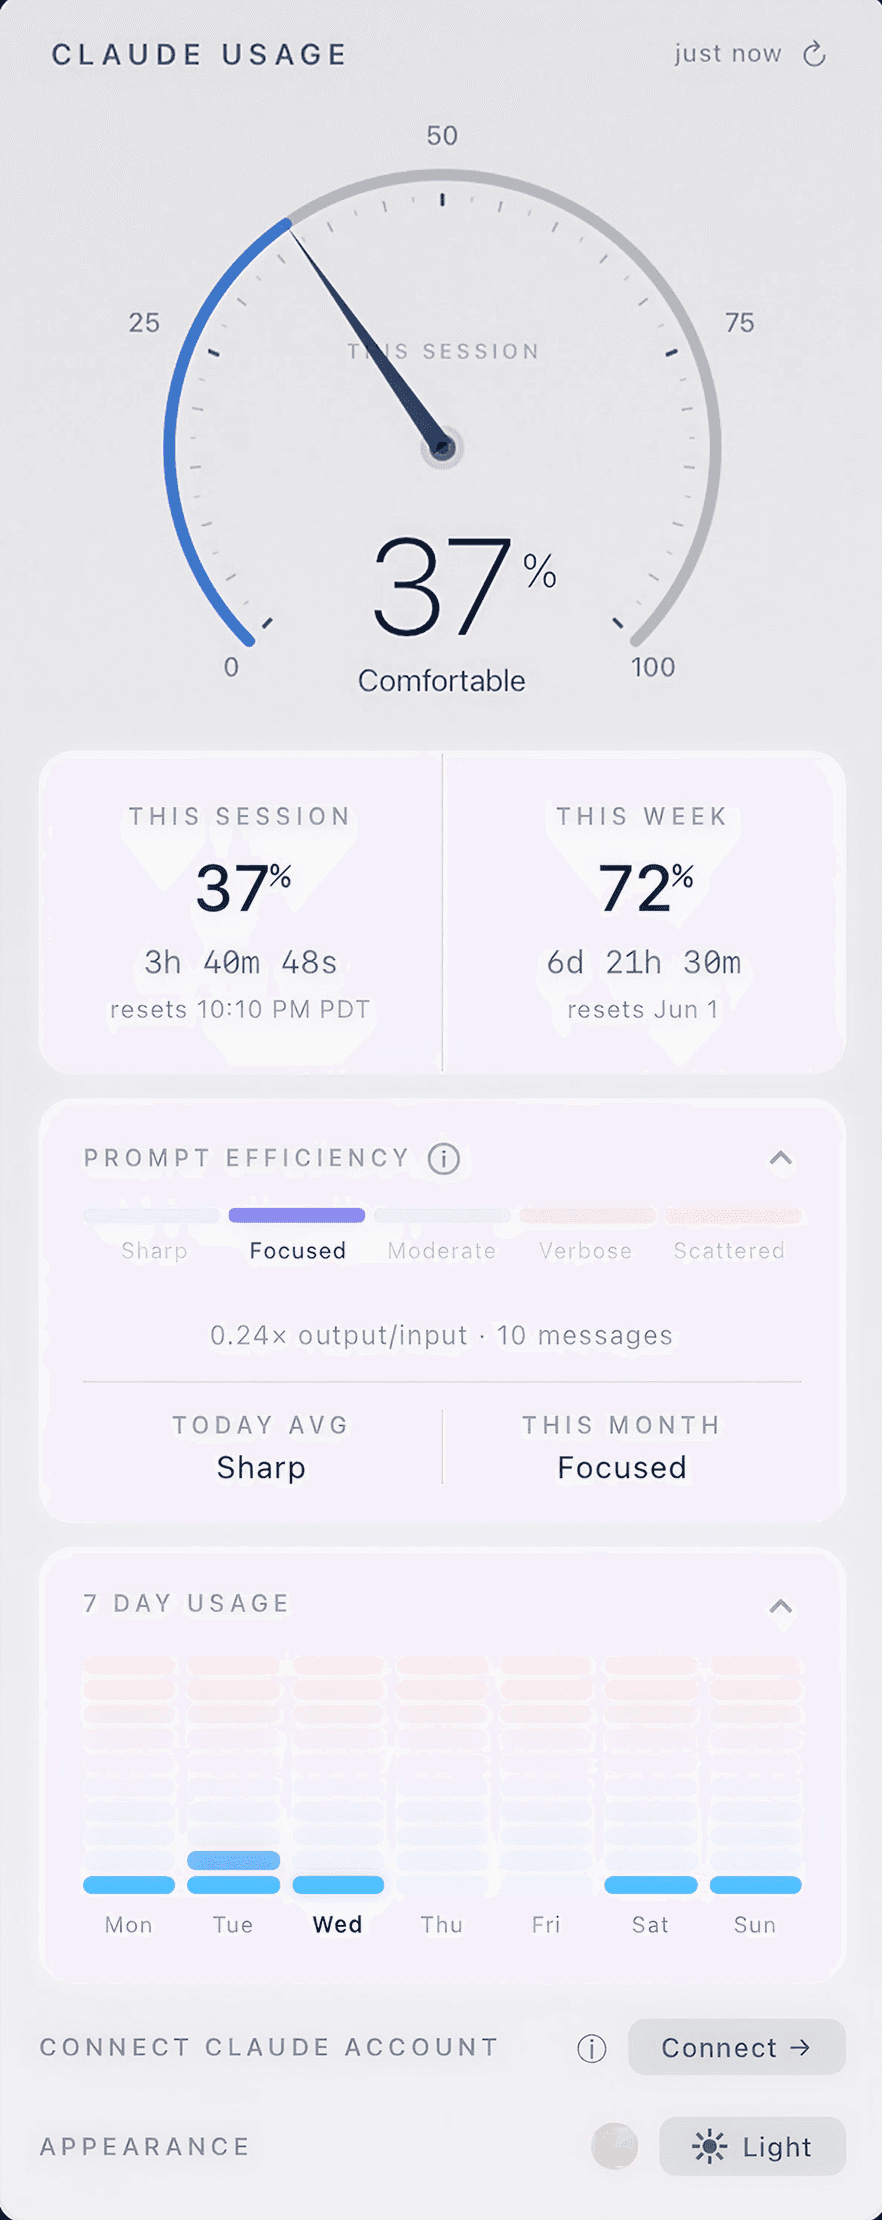
Click the icon and a popover opens with the full breakdown for session gauge, weekly usage, and exact reset times.
Desktop App linked to Claude Usage
Usage Tracking at a Glance:
Hover over the icon anytime to see your current session percentage. Click to expand the full popover without leaving whatever you're working on.
Color Change when usage near limit
The menu bar icon and gauge shift color as you approach the limit from neutral to amber to red so you get a warning before the limit cutoff.
Expanded Popup for more information
Click the menu bar icon and a popover expands with the full picture. Session usage, weekly usage, and exact reset times.
Chrome Cookie Session Key
Without an official API, the app authenticates using your browser session key to fetch live data from Claude.ai. You paste it once and it handles the rest.
Exploring the Visuals
The app ships with two visual modes beyond the default, each a different way to read the same data just different style exploration.
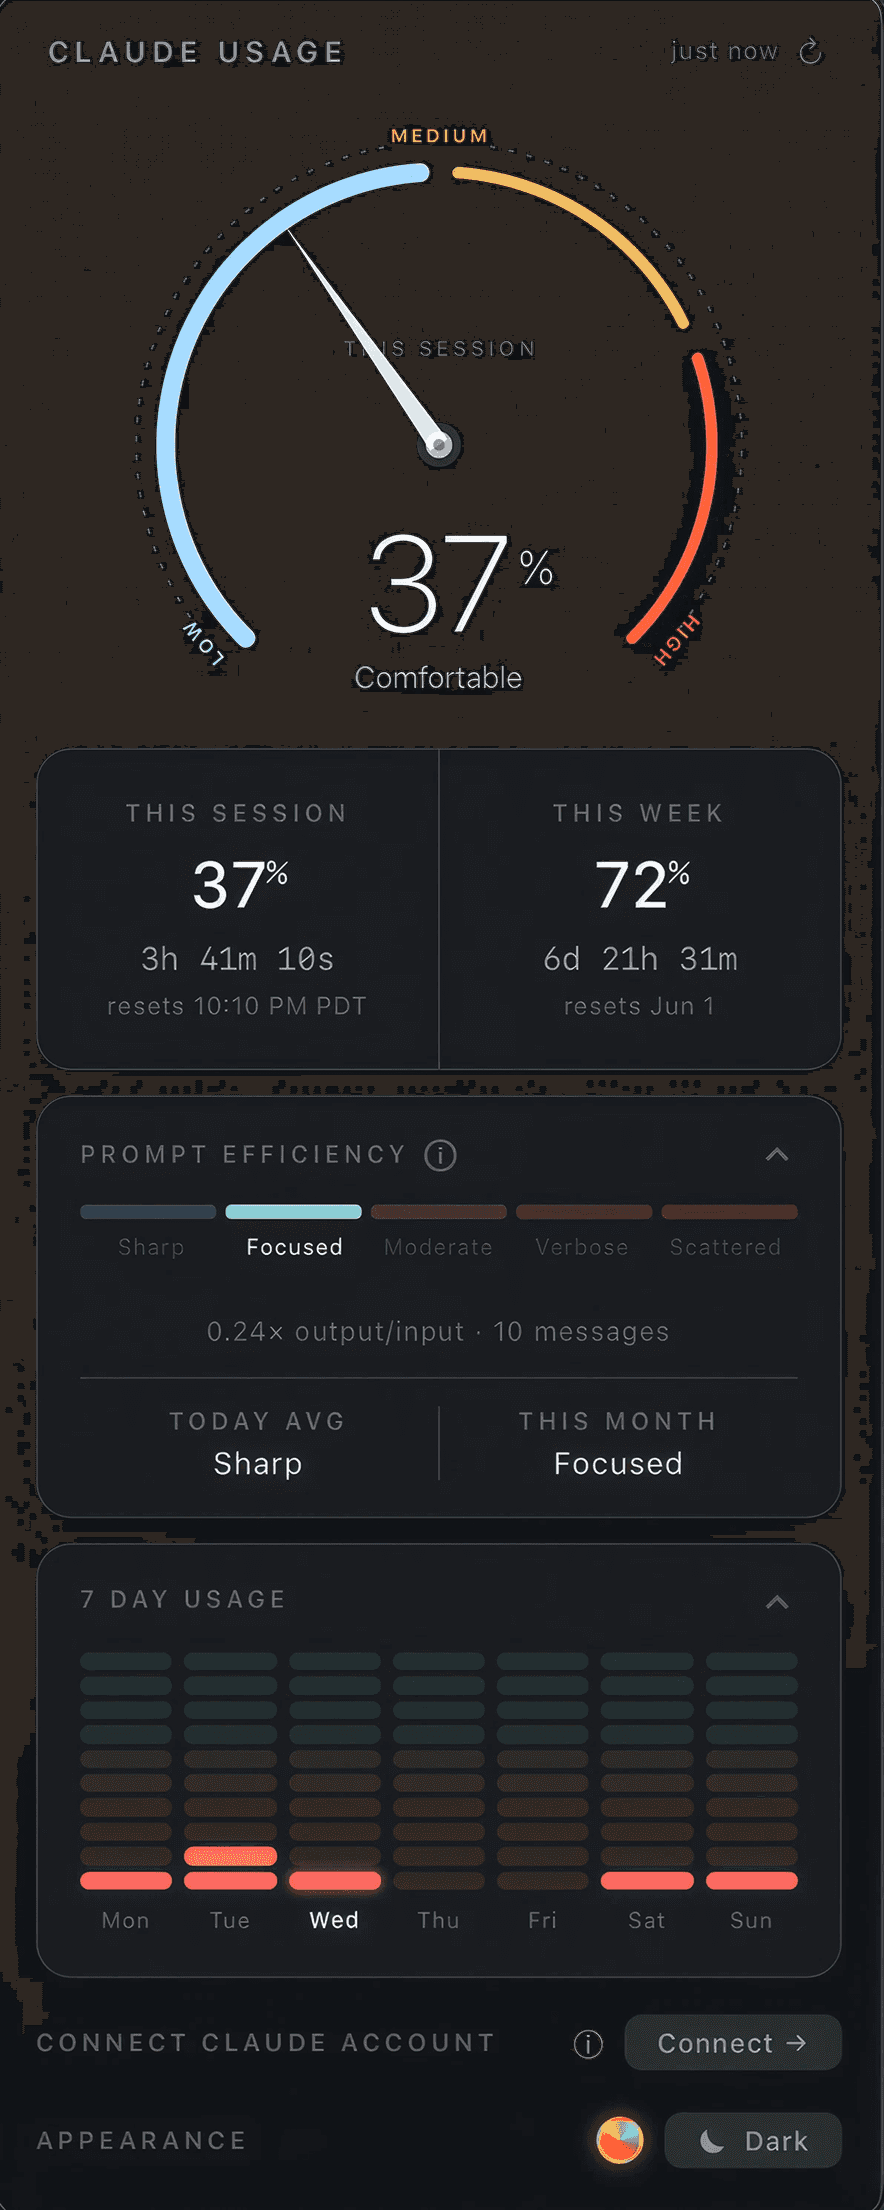
Carbon Mode
Inspired by performance dashboards and developer tooling the kind of high-contrast, data-dense displays you'd find on a racing HUD or a system monitor. The colored arcs pulse as usage climbs.
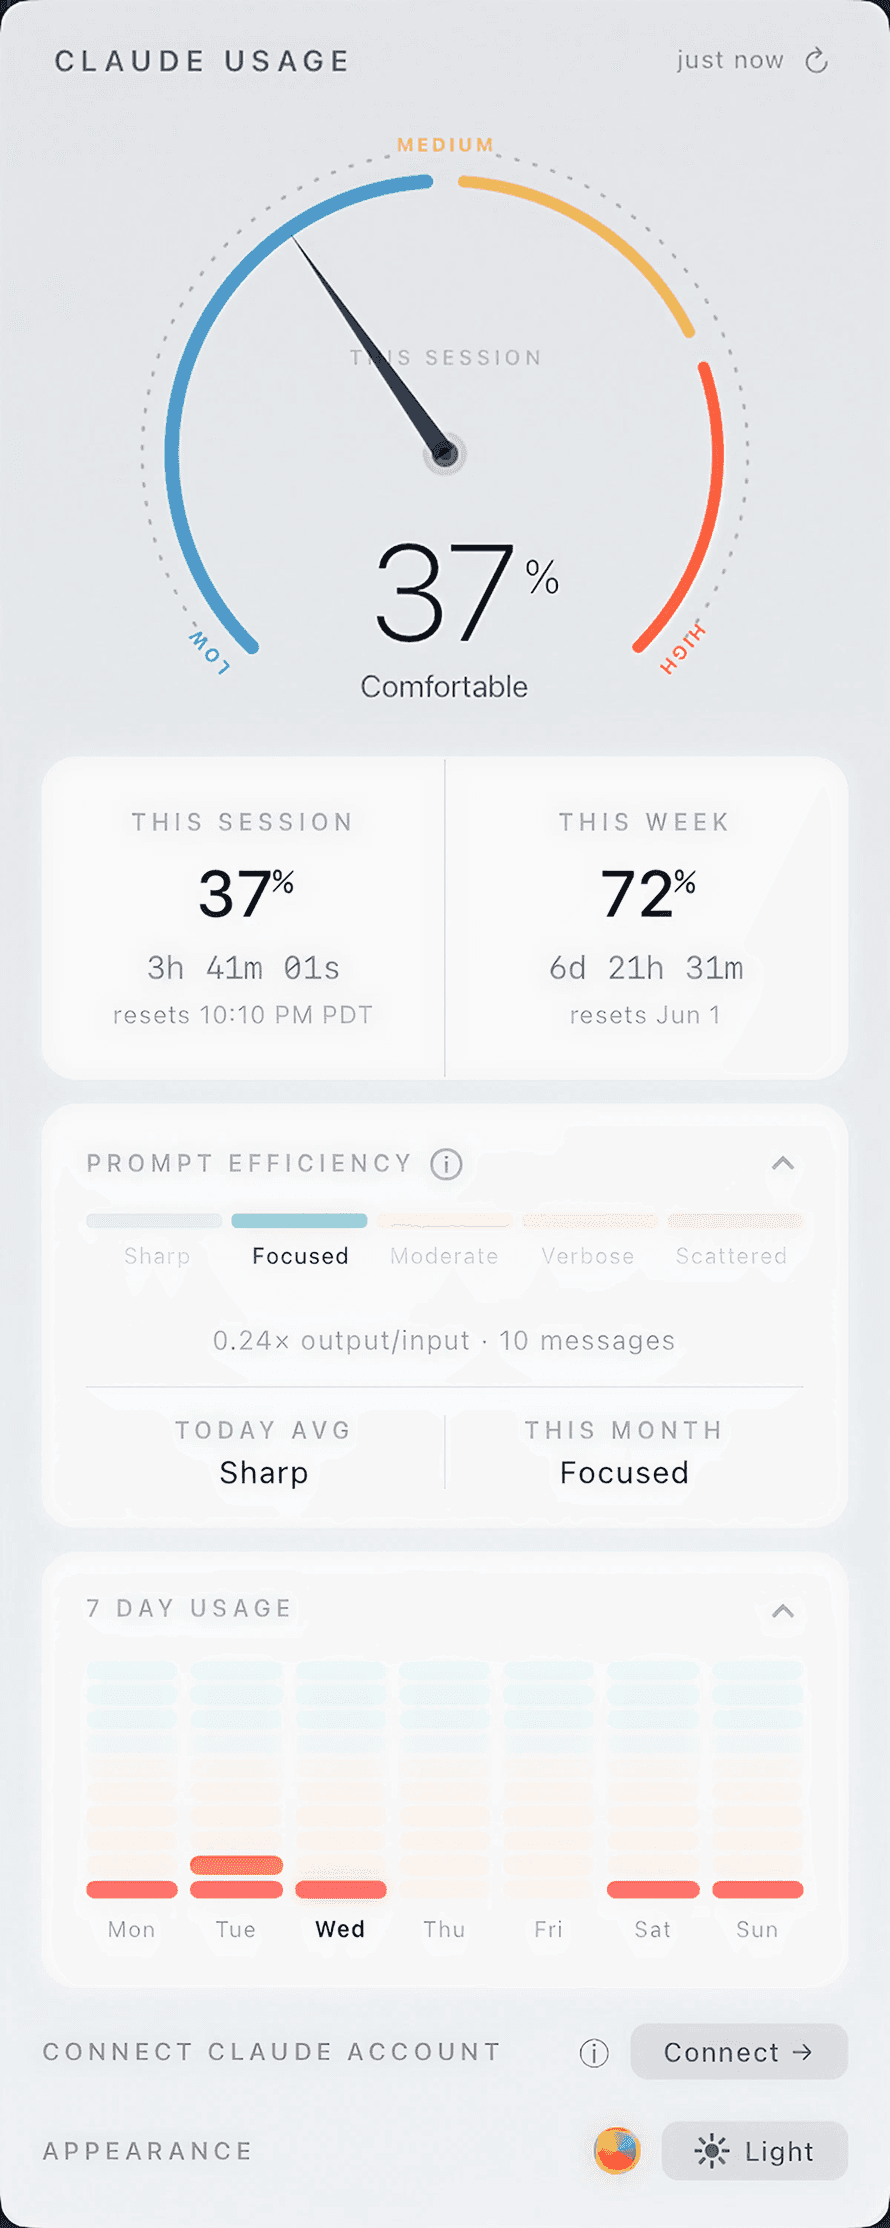
Aurora Mode
Inspired by the borealis, soft gradients that shift from cool blue to warm amber. The same data, but rendered with a quieter visual language less intense.
Modules
The core view covers the essentials. For users who want more, three optional modules can be toggled on
Hourly Heatmap
A 7×24 grid showing token usage by day and hour. Useful for spotting when you work hardest and where sessions tend to run long
7 Day Usage
A bar chart of your daily token consumption across the current week so you can see patterns more than just the current moment.
Prompting Efficiency
Tracks your output/input token ratio across the session, giving you a sense of how much useful work you're getting per prompt.